WP4-17: Difference between revisions
| (14 intermediate revisions by the same user not shown) | |||
| Line 54: | Line 54: | ||
They can be sum up as follows: | They can be sum up as follows: | ||
* | * Service for local and remote control, configuration and monitoring (CCM) | ||
* Selection and implementation of development of a TWR ranging scheme | * Selection and implementation of development of a TWR ranging scheme | ||
* Development of two versions of positioning algorithms | * Development of two versions of positioning algorithms | ||
==Validation== | |||
At the '''user application level''' the following figure provides an example where ACORDE validated the possibility to remotely configure, control and monitor the node. | |||
[[File:wp4-17_02.png|frame|center|An example of remote configuration, control and monitoring (CCM) of an UWB node of the ACORDE IPS]] | [[File:wp4-17_02.png|frame|center|An example of remote configuration, control and monitoring (CCM) of an UWB node of the ACORDE IPS]] | ||
| Line 65: | Line 65: | ||
In first place, a show command is issued to read the node status (monitoring). Then the position of the UWB anchor is manually configured, and then the node is reseted to ensure new configuration is applied (monitoring and control). Finally, a new show command is issued to check the effectivity of the CCM sequence. | In first place, a show command is issued to read the node status (monitoring). Then the position of the UWB anchor is manually configured, and then the node is reseted to ensure new configuration is applied (monitoring and control). Finally, a new show command is issued to check the effectivity of the CCM sequence. | ||
At the "ranging layer", as mentioned, ACORDE realised the importance on not only implementing, byt selecting and appropriate Two-Way Ranging (TWR) scheme. | |||
The following figure shows how two different TWR formulations were evaluated for four scenarios accounting tow typical error sources: | |||
* The error frequency of both the initiator and responder clocks (Δfi, Δfr, in parts per million, PPM) | |||
* The unbalancing on the reply times (Δt_reply). | |||
From these two error sources, four scenarios are defined: | |||
a) an ideal case: Δfi=0, Δfr=0, Δt_{reply}=0 | |||
b) average crystal frequency drifts crystal and minor reply time unbalance: Δfi=50PPM, Δfr=-50PPM, Δtreply=10µs | |||
c) average crystal frequency drifts crystal and feasible unbalance: Δfi=50PPM, Δfr=-50PPM, Δtreply=100µs | |||
d) average TCXO frequency drifts crystal and feasible unbalance: Δfi=4PPM, Δfr=-4PPM, Δtreply=100µs | |||
<gallery widths=300px heights=200px > | <gallery widths=300px heights=200px > | ||
File: | File: wp4_17_rg1.png | ideal case | ||
File: | File: wp4_17_rg2.png | average crystal frequency drifts crystal and minor reply time unbalance | ||
File: | File: wp4_17_rg3.png | average crystal frequency drifts crystal and feasible unbalance | ||
File: | File: wp4_17_rg4.png | average TCXO frequency drifts crystal and feasible unbalance | ||
</gallery> | |||
The a) scenario represents an ideal case and serves to show the analytical equivalence of the considered formulations. | |||
The b) scenario shows that for an averave drift on a platform with crystal clocks, a minor reply time unbalance, will already mean a significant range error (0.5m at 10mm distance) for 'formula2'. | |||
The c) scenario shows that considering a further, but quite feasible unbalance (100us), the error at 100m becomes 5m, yet 0.5m for 10m for 'formula2'. | |||
Then, d) scenario shows that even under consideration of some already provided platform inprovements (TCXO clock), the aforementioned error magnitude for 'formula2' holds, while 'formula1' remains insensitive. | |||
Therefore, the selection of the proper formulation ('formula1') is critical for error free range estimations. | |||
Furthermore, several indoor and outdoor physical set ups for range maximum range and accuracy estimation were set up. | |||
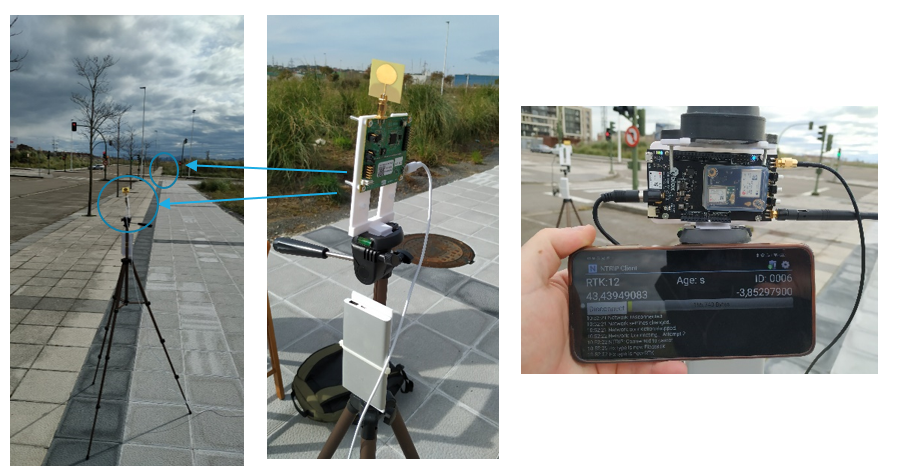
Following figure shows on of the outdoor set ups. For those set ups, two different ground truth references where used, namely RTK measurements (as shown on the right part), | |||
and also laser meters (i.e., outdoor experiments were indeed used to observed limitations of the used laser meters). | |||
[[File:wp4_17_outdoor_meas.png|frame|center|An example of remote configuration, control and monitoring (CCM) of an UWB node of the ACORDE IPS]] | |||
In all the experiments reported the cm-level error was confirmed, being the std error below 15cm in all experiments (including the original ones with the evaluation kit hw platform and others without final calibration). Las indoor experiment (for distances between 4m and 15m) yield maximum 1.7cm std error, and 10.1cm maximum RMSE. | |||
With regard geo-positioning algorityms, by the formal end of the project they have been mostly tested by realying on IPS-MAF platform. | |||
It has served to realise the high dependency with the morphology and density of the anchor deployment, and on the base range accuracy. | |||
A good example is what has been observed with autopositioning. | |||
In the ACORDE IPS solution, autopositioning is a feature which enables anchors inside the tunnel to compute their own position from external or already positioned anchors. | |||
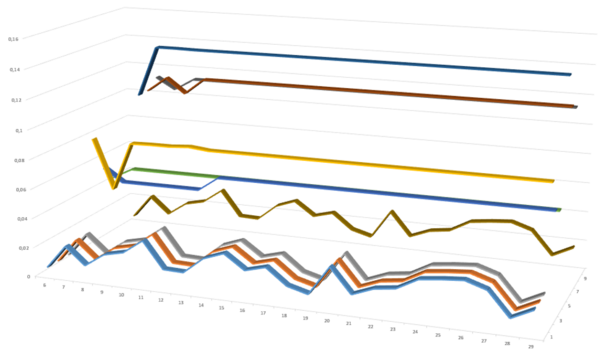
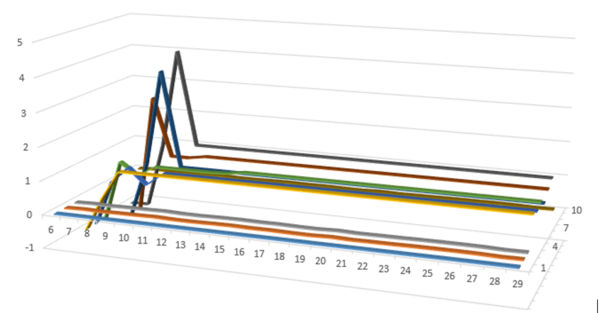
On Y axis, the positioning error is shown along time (x axis). | |||
In the figure below, each coloured graph line corresponds to the autopositioning error of one anchor for a naive deployment and using version 2 of anchors functionality. | |||
In such deployment, there are three static external anchors, whose autopositionin errors correspond to he three 'foreground' in the graph. | |||
These external anchor are lmost perfectly positioned from the beginning. Figure shows the progressive autopositioning of the inner anchors. | |||
The deeper the anchor (lines behind in the graph) the later the first autopositioning. | |||
<gallery widths=600px heights=600px > | |||
File: wp4_17_autopositioning_error0.png | ideal ranging conditions | |||
File: wp4_17_autopositioning_error.png | realistic ranging errors (5cm) | |||
</gallery> | </gallery> | ||
Moreover, the figure also shows other expected effects, like growing errors with the depth in the tunnel. | |||
More remarkably, the figure above also shows how the auto-positioning feature is impacted when realistic error range errors are considered. | |||
Latest revision as of 12:26, 14 March 2023
Anchor&Tag firmware of the Indoor Positioning System
| ID | WP4-17 |
| Contributor | ACORDE |
| Levels | Function |
| Require | Indoor Positioning System anchor and tag platforms WP3-15_1 |
| Provide | Navigation data (position) |
| Input | Raw sensed data from UWB transceiver. RTK enabled positioning out of the tunnel. INS data (on the tag). |
| Output | Position |
| C4D building block | |
| TRL | 4 |
| Parent Building block | WP3-15_1 |
| Contact | fernando.herrera at acorde.com |
This page introduced the software developed for Indoor Positioning solution developed by ACORDE in COMP4DRONES. It includes tag and anchor firmware (application and other underlying levels).
Description
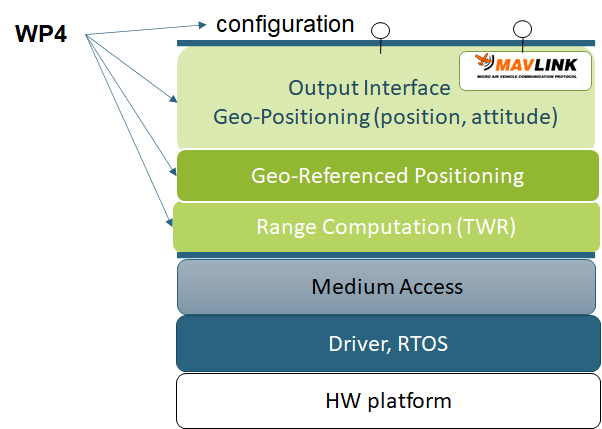
The following figure shows the several software layers present on top of the HW anchor&tag devices of the ACORDE Indoor Positioning Solution (IPS) addressed.
The development of the ACORDE IPS has required actions and developments on all these layers. Some of these layers have been tackled on other project WPs:
- BSP set up (in WP3)-15-1, which includes drivers and RTOS adaptation/configuration
- Medium Access Control protocol (in WP5-19_ACO), where acorde has made specific innovation.
The higher software levels of the soltions have been addressed in the context of the WP4 of COMP4RDRONES, as described in the figure.
The layers addressed are:
- Upper application layers, in charge of I/O interfacing (e.g. support of Mavlink API) and configuration.
- geo-positioning, which includes geo-positioning via trilateration and fusion techniques in general
- ranging, in charge of computation of ranges derived from the time metrics derived from UWB message exchages
Contributions
The efforts invested in WP4 for the uppers layers of the ACORDE IPS solution have been fruitful in the afore introduced layers.
They can be sum up as follows:
- Service for local and remote control, configuration and monitoring (CCM)
- Selection and implementation of development of a TWR ranging scheme
- Development of two versions of positioning algorithms
Validation
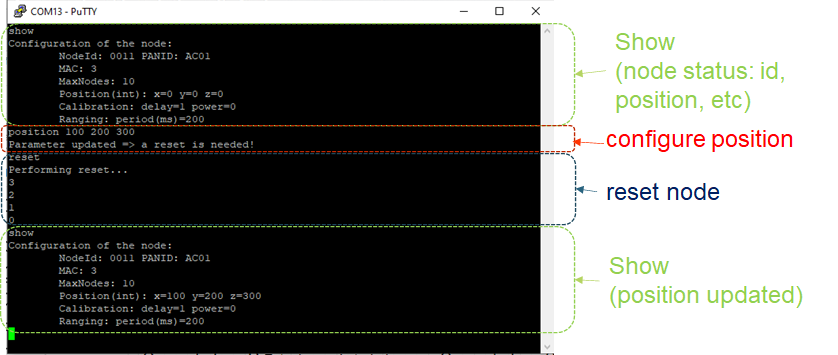
At the user application level the following figure provides an example where ACORDE validated the possibility to remotely configure, control and monitor the node.
In first place, a show command is issued to read the node status (monitoring). Then the position of the UWB anchor is manually configured, and then the node is reseted to ensure new configuration is applied (monitoring and control). Finally, a new show command is issued to check the effectivity of the CCM sequence.
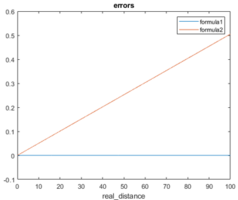
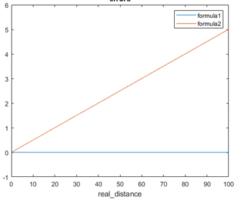
At the "ranging layer", as mentioned, ACORDE realised the importance on not only implementing, byt selecting and appropriate Two-Way Ranging (TWR) scheme. The following figure shows how two different TWR formulations were evaluated for four scenarios accounting tow typical error sources:
- The error frequency of both the initiator and responder clocks (Δfi, Δfr, in parts per million, PPM)
- The unbalancing on the reply times (Δt_reply).
From these two error sources, four scenarios are defined:
a) an ideal case: Δfi=0, Δfr=0, Δt_{reply}=0
b) average crystal frequency drifts crystal and minor reply time unbalance: Δfi=50PPM, Δfr=-50PPM, Δtreply=10µs
c) average crystal frequency drifts crystal and feasible unbalance: Δfi=50PPM, Δfr=-50PPM, Δtreply=100µs
d) average TCXO frequency drifts crystal and feasible unbalance: Δfi=4PPM, Δfr=-4PPM, Δtreply=100µs
The a) scenario represents an ideal case and serves to show the analytical equivalence of the considered formulations. The b) scenario shows that for an averave drift on a platform with crystal clocks, a minor reply time unbalance, will already mean a significant range error (0.5m at 10mm distance) for 'formula2'. The c) scenario shows that considering a further, but quite feasible unbalance (100us), the error at 100m becomes 5m, yet 0.5m for 10m for 'formula2'. Then, d) scenario shows that even under consideration of some already provided platform inprovements (TCXO clock), the aforementioned error magnitude for 'formula2' holds, while 'formula1' remains insensitive. Therefore, the selection of the proper formulation ('formula1') is critical for error free range estimations.
Furthermore, several indoor and outdoor physical set ups for range maximum range and accuracy estimation were set up. Following figure shows on of the outdoor set ups. For those set ups, two different ground truth references where used, namely RTK measurements (as shown on the right part), and also laser meters (i.e., outdoor experiments were indeed used to observed limitations of the used laser meters).
In all the experiments reported the cm-level error was confirmed, being the std error below 15cm in all experiments (including the original ones with the evaluation kit hw platform and others without final calibration). Las indoor experiment (for distances between 4m and 15m) yield maximum 1.7cm std error, and 10.1cm maximum RMSE.
With regard geo-positioning algorityms, by the formal end of the project they have been mostly tested by realying on IPS-MAF platform. It has served to realise the high dependency with the morphology and density of the anchor deployment, and on the base range accuracy. A good example is what has been observed with autopositioning. In the ACORDE IPS solution, autopositioning is a feature which enables anchors inside the tunnel to compute their own position from external or already positioned anchors. On Y axis, the positioning error is shown along time (x axis).
In the figure below, each coloured graph line corresponds to the autopositioning error of one anchor for a naive deployment and using version 2 of anchors functionality. In such deployment, there are three static external anchors, whose autopositionin errors correspond to he three 'foreground' in the graph. These external anchor are lmost perfectly positioned from the beginning. Figure shows the progressive autopositioning of the inner anchors. The deeper the anchor (lines behind in the graph) the later the first autopositioning.
Moreover, the figure also shows other expected effects, like growing errors with the depth in the tunnel. More remarkably, the figure above also shows how the auto-positioning feature is impacted when realistic error range errors are considered.
